The Sharesies Portfolio Heatmap Generator: A New Perspective on Your Investments
By Chris Koch on 2025-06-15
At its heart, the Sharesies Portfolio Heatmap Generator is a powerful tool designed to transform the standard, spreadsheet-like reports from your Sharesies account into a vibrant, interactive, and instantly understandable visual dashboard. It was built with a simple goal: to help everyday Kiwi investors see and understand the story of their portfolio in a way they never have before.
What's the Big Idea?
Your portfolio isn't just a list of numbers; it's a collection of decisions, wins, and lessons learned over time. This tool moves beyond static rows and columns to give you an intuitive, "at-a-glance" feel for your investments. It answers key questions instantly:
- Which of my investments make up the biggest slice of the pie right now?
- Which are my star performers, and which are lagging behind?
- For any given stock, have I actually taken more money out than I put in?
- What does the entire history of my involvement with a company look like?
How It Works: Your Data, Your Browser, Your Insights
The process is designed with your privacy and ease-of-use as top priorities.
Secure & Private Data Upload: You start by downloading two standard reports from your Sharesies account: the "Investment Holdings Report (CSV)" and the "Transaction Report (CSV)". You then simply drag and drop these two files into the tool. That's it. Your financial data is processed securely within your browser session and is never stored or saved anywhere.
Intelligent Analysis: In the background, the tool gets to work. It intelligently uses your transaction report as the single source of truth for your entire investment history. It meticulously calculates the total amount you've spent on every "buy" and received from every "sell," including all associated fees. It automatically converts all foreign currency transactions (like in USD or AUD) into New Zealand Dollars (NZD) using up-to-date rates, so you can compare everything on a level playing field.
The Features: See, Click, and Understand
The real magic happens in the visualization:
-
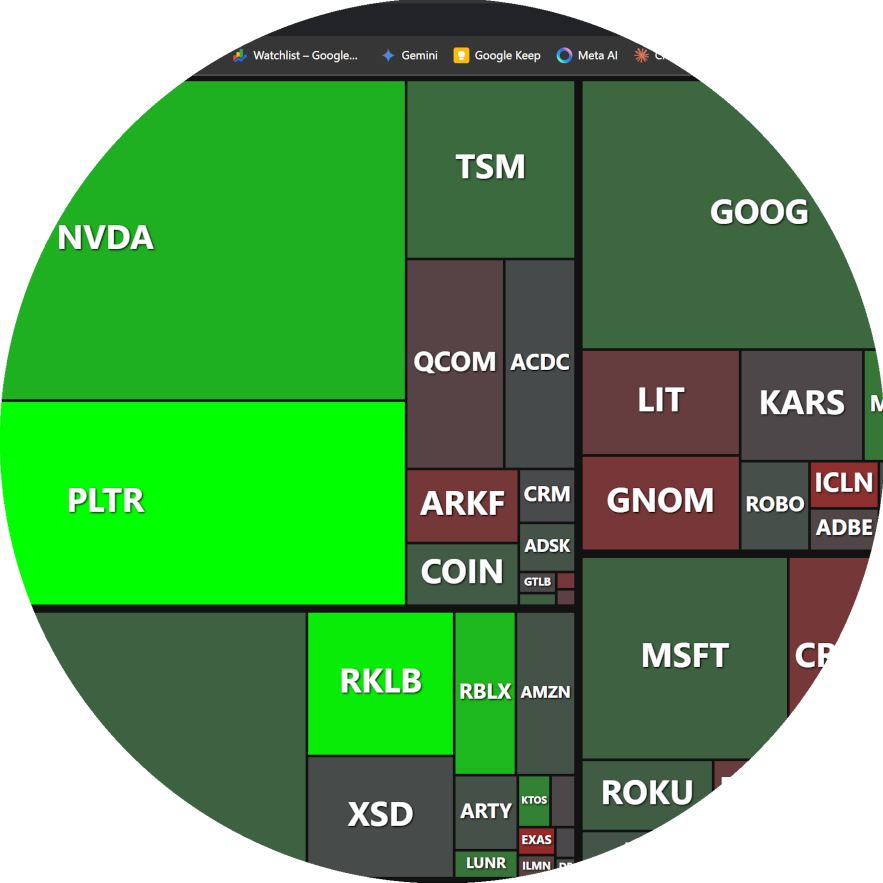
The Interactive Heatmap:
This is your portfolio's command centre. Each investment you currently hold is represented by a rectangle.
- Size = Current Value: The size of each block shows you its current NZD market value. Your biggest holdings are instantly obvious as the largest rectangles.
- Colour = Lifetime Return: The colour of each block tells you its lifetime performance as a percentage. Bright green means a big win, bright red means a significant loss, and grey means it's hovering around your break-even point. This allows you to spot your winners and losers in a heartbeat.
-
The In-Depth Detail View:
When you click on any rectangle, you drill down into a dedicated overview for that specific stock.
- Key Metrics: You get a clean summary showing your total money invested, total money received from sales, total dividends, current value, and your ultimate lifetime profit or loss, all in NZD.
-
Investment Journey Line Chart: This is perhaps the most powerful feature. It’s a line chart that tracks your "net invested capital" over time.
- The line goes up with every buy and down with every sell.
- If the line is above $0 (and coloured blue), it means you have that much of your own capital currently at risk.
- If you sell enough to recoup all your initial costs, the line drops below $0 and turns green. This is the "house money" zone—a clear, visual confirmation that you've secured a profit and any value left is pure gain.
-
Anonymous Saving & Sharing:
Once your heatmap is generated, you have the option to save and share it anonymously. With a simple click, the tool generates a unique, private link that lets you or others view your specific heatmap again, without ever revealing your personal information.
By combining a high-level visual overview with the power to drill down into the granular details of each investment's history, this tool empowers you to understand your portfolio's past, assess its present, and make more informed decisions for the future.
Go to the Sharesies Portfolio Heatmap Generator